PySpark for Postprocessing
Technical Description of Code
Associated Files
- runtask.sh - a bash script for submitting ED_evolve_csv.m to the academic cluster
- parallel.sbatch - a bash script for submitting many runtask.sh tasks in parallel
- ED_evolve_csv.m - A non-block diagonal implementation for the quantum simulator, used for the purpose of generating test CSV files for testing PySpark - speedup
- polarization_avg_spark.py - a PySpark script (parallel) for averaging polarizations from CSV files from many runs of the quantum simulator with random initial conditions
- polz_avg_test_nospark.py - a python script using pandas (serial) for averaging polarizations from CSV files from many runs of the quantum simulator with random initial conditions
Run Instructions
Here are instructions for running the PySpark tests for the quantum simulator. More detailed reproducibility information is in the section below.
To use the academic cluster to run the CSV test for the quantum simulator and generate CSVs containing polarization information for processing in PySpark, log into the academic cluster, click Clusters-> _FAS-RC Shell Access, and clone the repo into the cluster. Cd into the code directory, then run on the terminal the following command:
$ sbatch parallel.sbatch
If necessary, you may need to first clean up files from previous run:
$ rm runtask.sh.*
$ rm runtask.log
$ rm slurm-*
$ rm -r testdir_spark
To modify the number of iterations, open parallel.sbatch, and on line 38, change the ‘1000’ in the line
$parallel "$srun ./runtask.sh arg1:{1} > runtask.sh.{1}" ::: {1..1000}
to the desired number of iterations. To change N (qubit number) or M (number of time steps), open runtask.sh And modify the arguments of ED_evolve_csv in following line:
matlab -nosplash -nodisplay -r "ED_evolve_csv(4, 1000, 0, $PARALLEL_SEQ, '$MYDIR/testdir_spark')"
Here, I’ve set the number of qubits to 4 (since we are just testing the averaging portion of the code, rather than the GPU acceleration), and the number of time steps to 1000. These can be changed if desired. If you get an error saying runtask.sh will not execute, try running:
$ chmod u+x runtask.sh
The CSVs will be generated in a folder in the same directory called testdir_spark. Next, zip this folder:
$ zip -r testdir_spark.zip testdir_spark
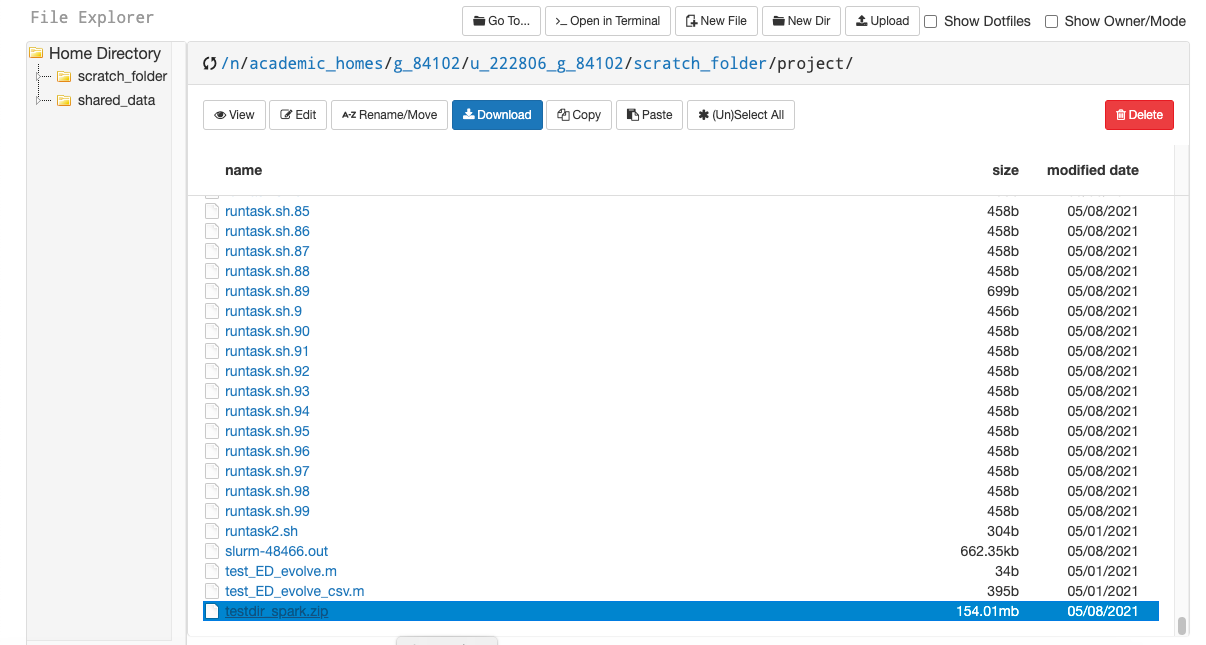
Then download it from the file explorer on the academic cluster:

Spin up an AWS instance following the steps in lab 9, and follow those steps to install PySpark locally as well. Choose a c4.xlarge. Use scp to copy testdir_spark.zip, polarization_avg_spark.py, and polz_avg_test_nospark.py to the AWS instance. Then run
$ sudo apt-get install unzip
$ unzip testdir_spark.zip
$ sudo apt install python
To run the serial, non-spark script polz_avg_test_nospark.py (the PySpark version does not use pandas! But the serial version does), we will need to install some python packages. In the command line, run
$ sudo apt install python-pip
$ pip install pandas
Finally, to submit the completely serial, pandas version as a test, use the command
$ python polz_avg_test_nospark.py testdir_spark
And to submit the parallel PySpark version, use the command
$ spark-submit polarization_avg_spark.py testdir_spark
To change the number of local cores when running Spark locally, one can open polarization_avg_spark.py and modify the following line:
conf = SparkConf().setMaster('local').setAppName('Polarization Calculator')
to
conf = SparkConf().setMaster('local[n]').setAppName('Polarization Calculator')
where n is the desired number of local cores.
Lastly, we can try running the code on a Spark cluster. To submit on a Spark cluster, follow the steps from lab 10. We use a m4.xlarge, as used in lab 10. SSH into the Spark cluster terminal, upload testdir_spark, and unzip, as explained above. The same libraries mentioned above will need to be loaded in. Open port 22 on the master security group by adding an SSH rule with port 22 and source 0.0.0.0/0, then scp to copy in polarization_avg_spark.py.
Run
$ hadoop fs -put testdir_spark
Open polarization_avg_spark.py and modify the remove setMaster(‘local’) from the following line:
conf = SparkConf().setMaster('local').setAppName('Polarization Calculator')
And save. Then, run
$ spark-submit --num-executors 2 --executor-cores 4 polarization_avg_spark.py testdir_spark
With 2 and 4 modified as needed.
csvs with the averaged polarizations, as well as with the times, will be saved in testdir_spark.
Performance Evaluation
Parallel Speedup
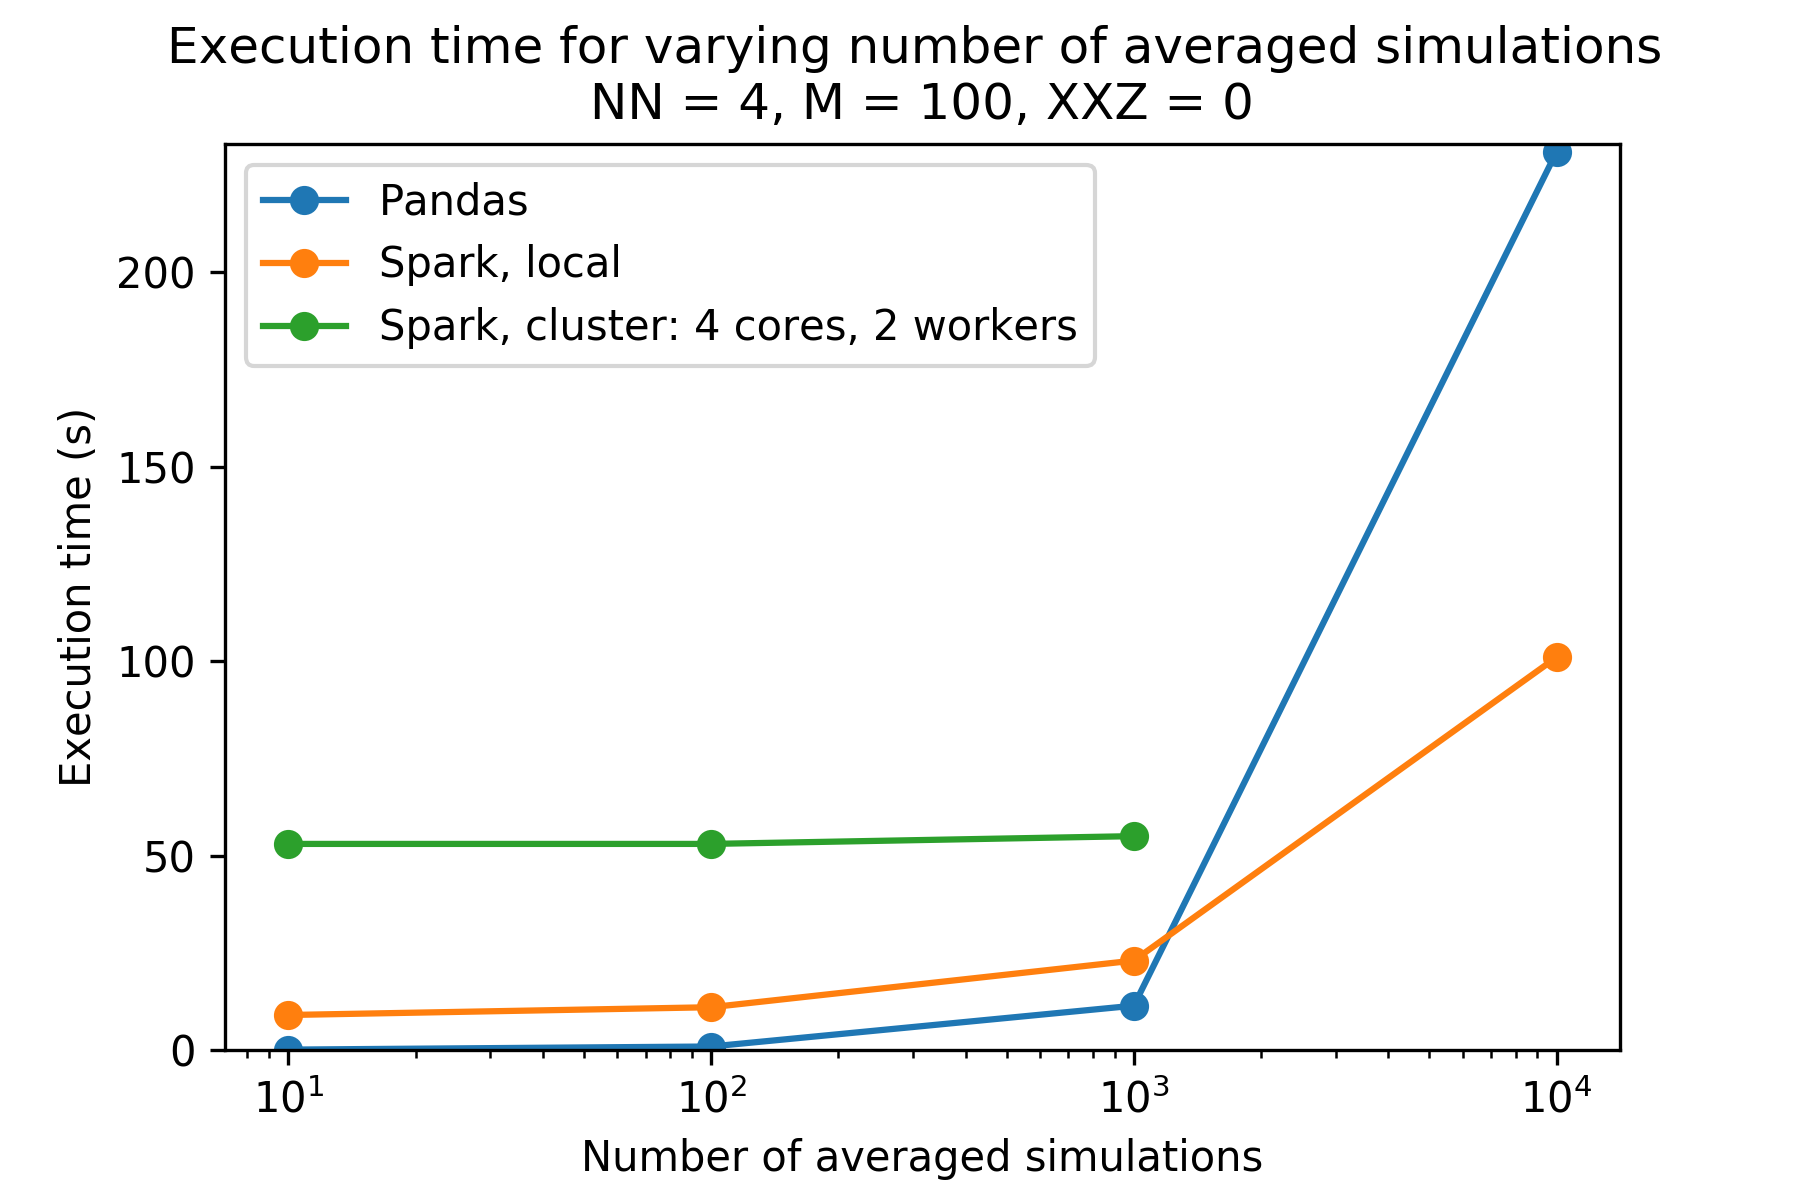
 The plot above shows the execution times for different numbers of simulation runs, given N (number of spins) is 4 and M (number of timesteps) is 100. One can see the PySpark versions take much longer than the pandas version for number of iterations less than 10,000. The cluster PySpark took longer than 30 minutes to load in the data (via -put) for iterations equal to 10,000, and so is not included. Reproducibility information is below.
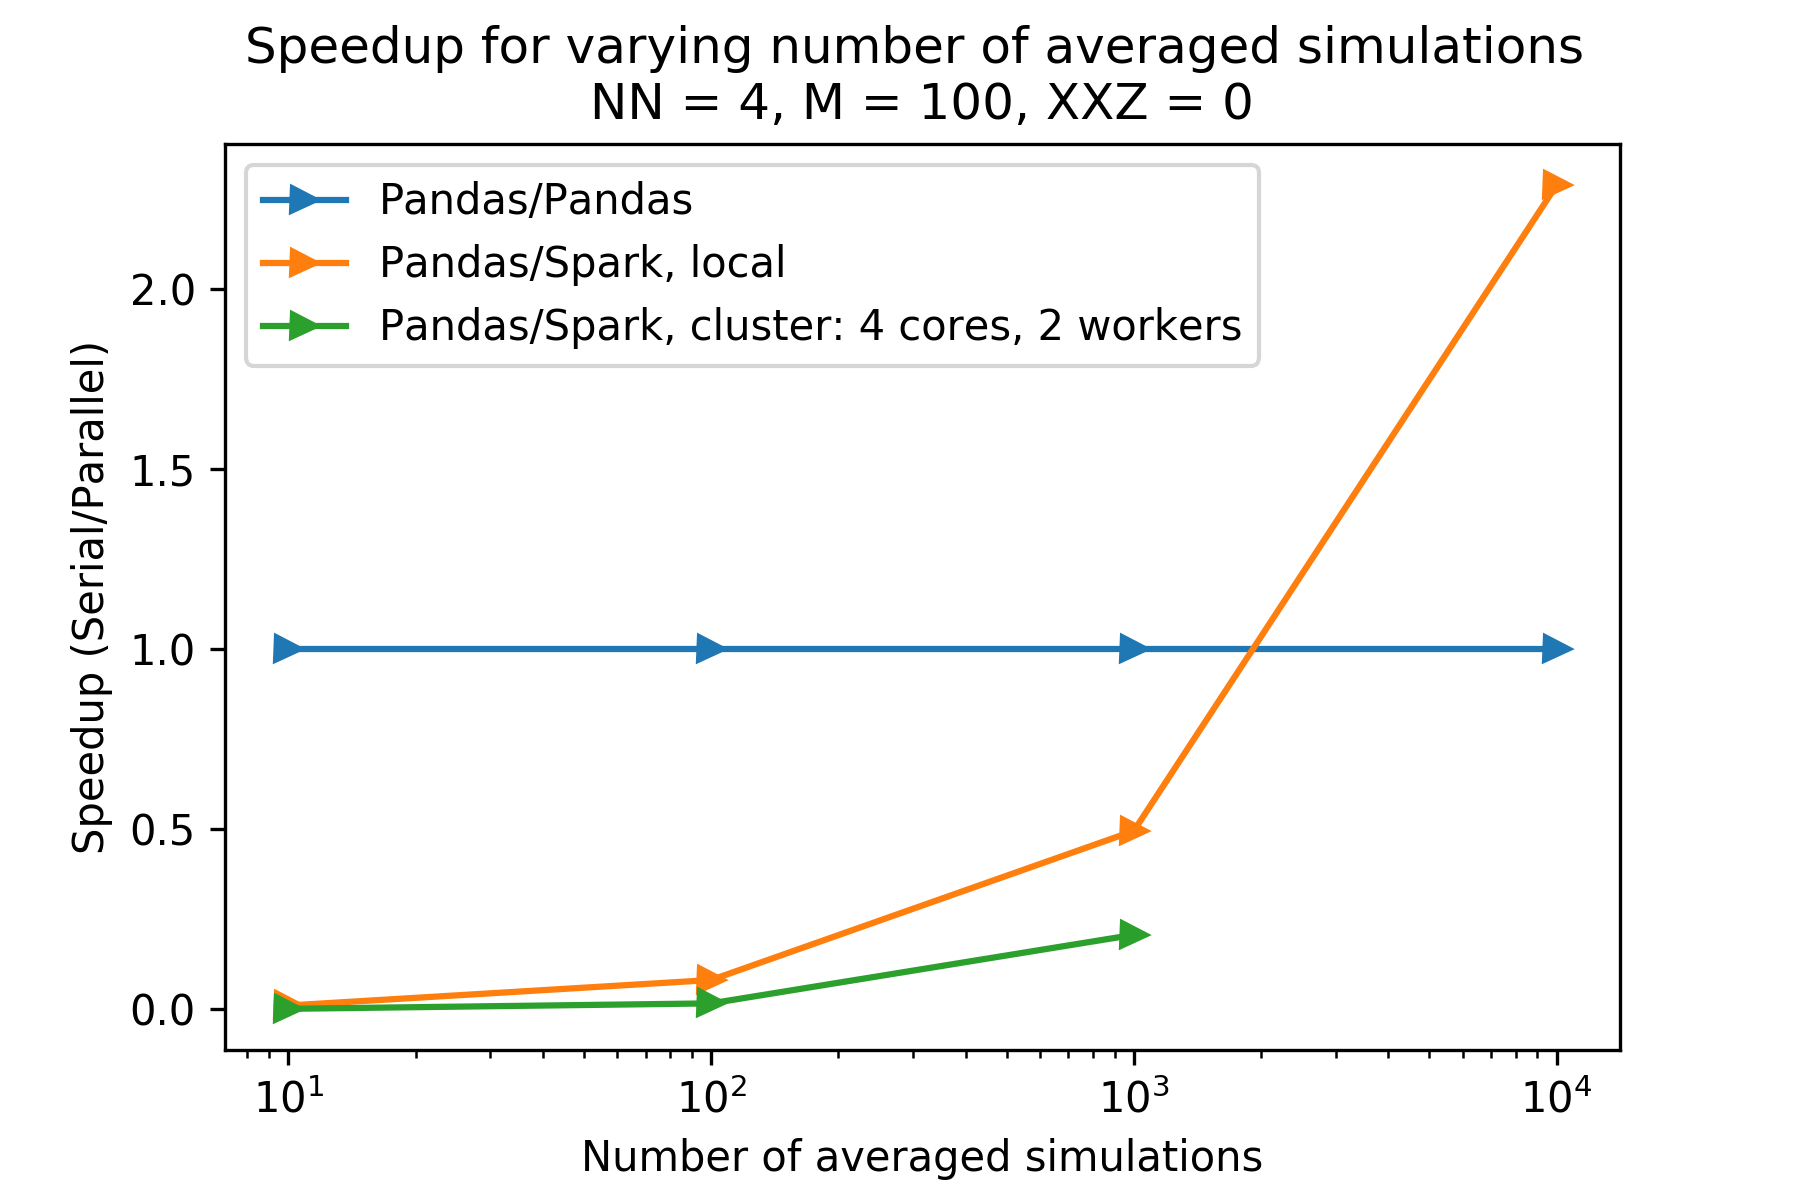
 The plot above shows the speedups for different numbers of simulation runs, given N (number of spins) is 4 and M (number of timesteps) is 100. One can see the PySpark versions have a speedup less than 1 (compared to the pandas version) for for number of iterations less than 10,000. The cluster PySpark took longer than 30 minutes to load in the data (via -put) for iterations equal to 10,000, and so is not included. Reproducibility information is below.
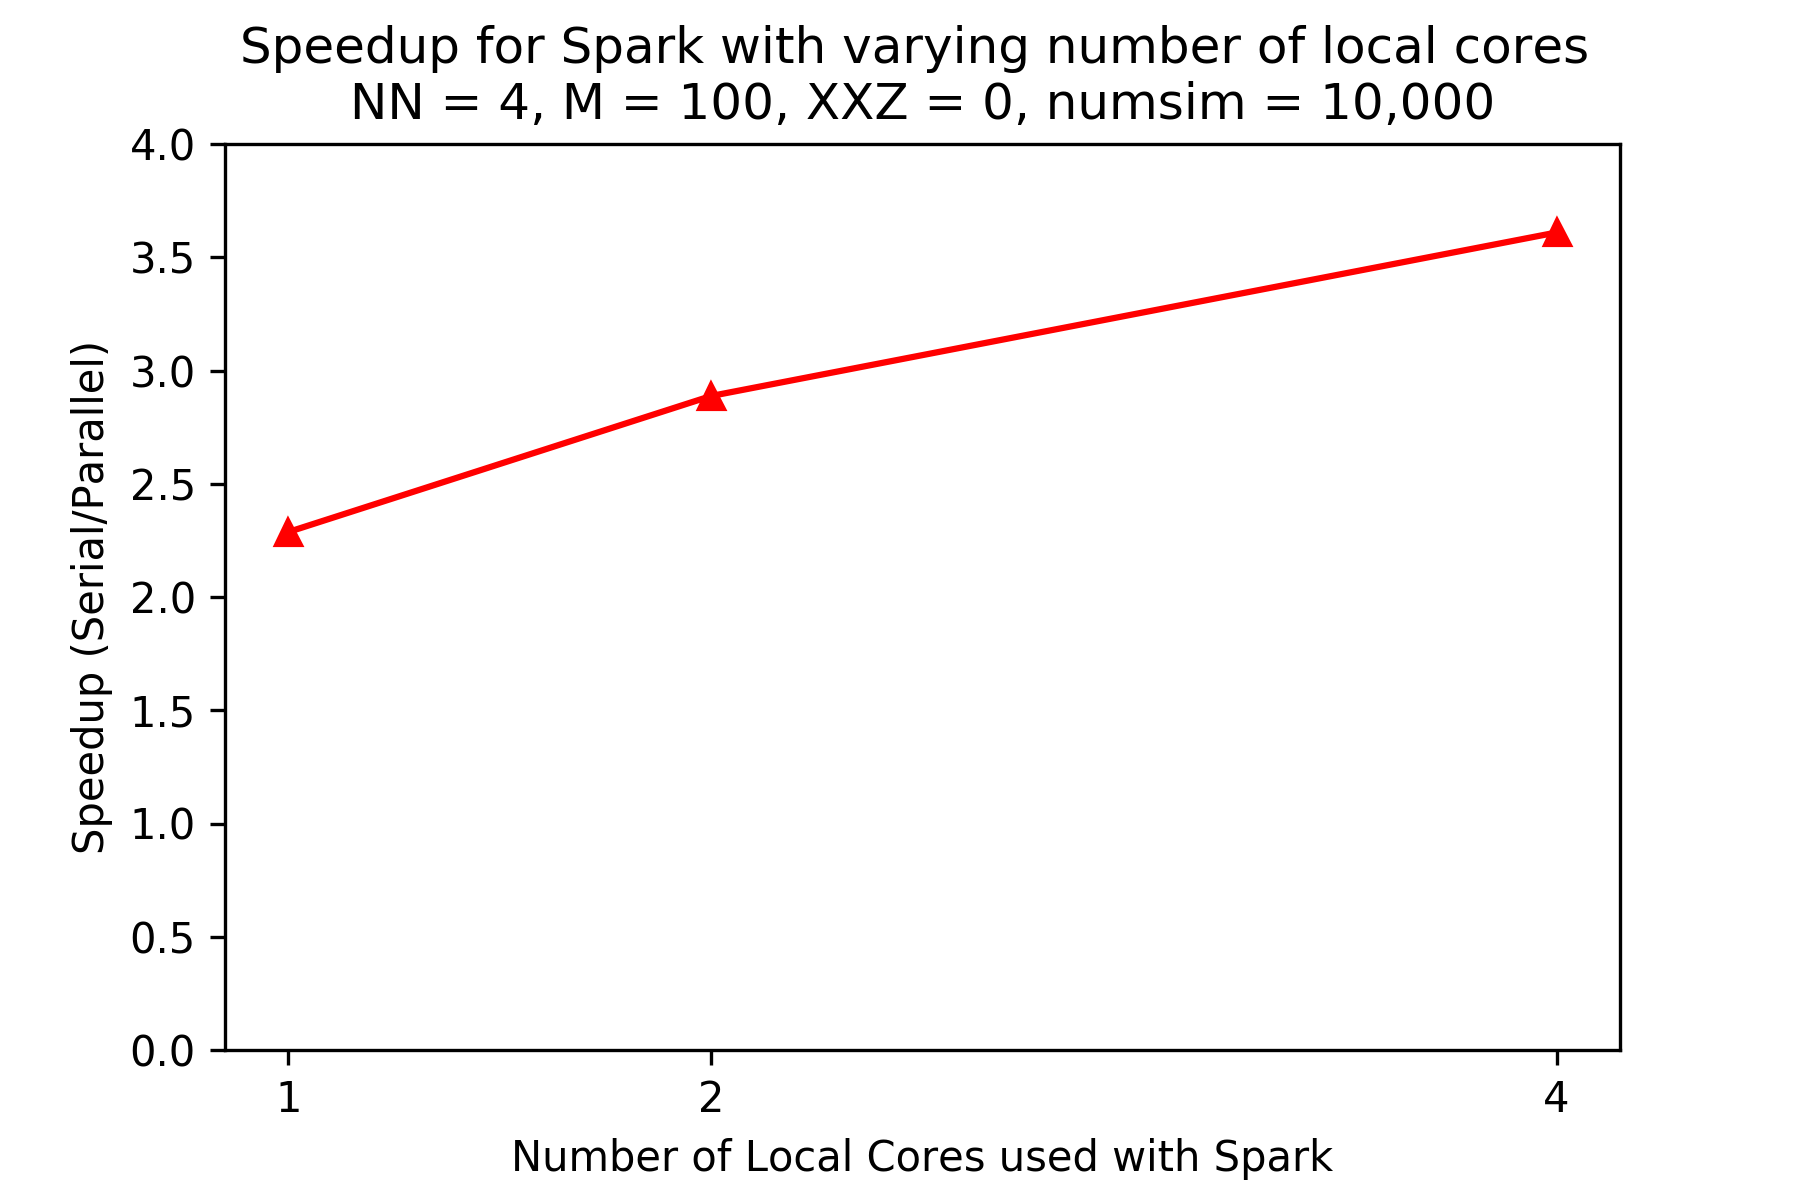
 The plot above shows the speedups (compared to the pandas version) for the PySpark version running locally on an AWS instance (reproducibility information below) for different numbers of local cores, given N (number of spins) is 4 and M (number of timesteps) is 100, and 10,000 iterations. There is significant increase in speedup as number of cores increase. Plotting is stopped at 4 cores as the machine used had 4 physical cores.
Reproducibility
The preceding plots were produced using the academic cluster, then using AWS instances or an AWS Spark cluster. To time the Spark portions, I used the timer on my phone (since the code ran slow enough to make this feasible).
Reproducibility information for academic cluster portion:
Harvard FAS-OnDemand
Model: AMD Opteron(tm) Processor 6376
Number of CPUs: 64
Number of cores per CPU: 32
Threads per core: 2
Number of logical cores: 4096
Clock rate: 2300.061 MHz
Cache memory: L1d cache: 16K, L1i cache: 64K, L2 cache: 2048K, L3 cache: 6144K
Main memory: 128GB
Operating System Version: CentOS Linux 7 (Core)
Kernel Version: Linux 3.10.0-1127.18.2.el7.x86_64
Compiler (name and version):
matlab/R2021a-fasrc01
Reproducibility information for AWS single node:
Replicability information:
Model: Intel(R) Xeon(R) CPU E5-2666 v3
Number of CPUs: 4
Number of sockets per CPU: 1
Number of cores per socket: 2
Threads per core: 2
Number of logical cores: 16
Clock rate: 2.90GHz
Cache memory: L1d cache: 32K, L1i cache: 32K, L2 cache 256K, L3 cache 25600K
Main memory: 8 GB
Operating system version: Ubuntu 18.04.5 LTS
Kernel version: Linux 5.4.0-1038-aws
Compilers:
python 2.7.17 (default, Feb 27 2021, 15:10:58) [GCC 7.5.0]
openjdk version “1.8.0_282”
OpenJDK Runtime Environment (build 1.8.0_282-8u282-b08-0ubuntu1~18.04-b08)
OpenJDK 64-Bit Server VM (build 25.282-b08, mixed mode)
Scala code runner version 2.11.12 – Copyright 2002-2017, LAMP/EPFL
pyspark 2.2.0
Reproducibility information for AWS Spark cluster:
Replicability information:
I followed the steps in lab 10 to create a Spark cluster on Amazon EMR.
Model: Intel(R) Xeon(R) CPU E5-2686 v4
Number of CPUs: 4
Number of sockets per CPU: 1
Number of cores per socket: 2
Threads per core: 2
Number of logical cores: 16
Clock rate: 2.30GHz
Cache memory: L1d cache: 32K, L1i cache: 32K, L2 cache 256K, L3 cache 46080K
Main memory: 16 GB
Operating system version: Ubuntu 18.04.5 LTS
Kernel version: Linux 4.14.154-99.181.amzn1.x86_64 x86_64
Compilers:
Java:
openjdk version “1.8.0_282”
OpenJDK Runtime Environment (build 1.8.0_282-b08)
OpenJDK 64-Bit Server VM (build 25.282-b08, mixed mode)
pyspark 2.4.4
Latency: 65 ms
Bandwidth: 900 Hz
Tests
Tests are available >a href “https://github.com/oksana-makarova/CS205-QuantumSimulations/tree/main/testdir_spark”>link here </a>.
Challenging Aspects
-
It is worth noting that the overhead for starting up PySpark is quite great. When submitting only 10 or 100 csv files to be averaged on the AWS machine (plot above), it took about 10 seconds using PySpark in local mode but only 0.9 seconds using the serial pandas version polz_avg_test_nospark.py. And even worse, it took 53 seconds on the PySpark cluster with 4 cores and 2 workers. We finally did see speedup when averaging and sorting across 10,000 when using Spark in local mode on an AWS instance.
-
It’s also important to note that the number of columns is restricted when using PySpark. When I tried running polarization_average_spark.py with 10,000 columns (meaning 10,000 time steps) I ran into an error that stated the constant pool had grown past JVM limit of 0xFFFF. It makes sense that the number of columns would be limited, though, since PySpark is more suited for datasets with many rows rather than many columns.
Final Thoughts
- Overall PySpark seems to be a bad tool for collating and averaging across the three polarization measurements when the number of time divisions is large (100 to 1000) and when the number of simulations run is relatively small (1000 or so). However, for 10,000 iterations, PySpark becomes the better tool. However, because of the poor performance with lower number of iterations, we left the PySpark portion as a standalone and did not integrate with the rest of the code.
- For future work, it would be interesting to see if expanding the number of calculations performed per simulation (adding in additional observables besides total polarization to calculate at each timestep) to produce longer datasets, and reducing the number of timesteps could potentially lead to more advantage in using Spark.